


The shipping, energy equipment and services industry are notorious for being cash-hungry, capex-hungry, and debt-dependent. Hundreds of millions of cash outlay are typically required for the vessels and equipment to come online years later. Access to debt and equity capital is easy when the market is frothy and there seem to be no other alternatives. This leads to overbuilding and excess supply when new builds come online.
In summary - High profit margins attract capital, capital expenditure ramps up, competition increases, supply increases, day rates plummet, margins are squeezed, and poorly-positioned companies go bust, competition decreases, supply improves, and day rates start to increase again.
This is the boom-bust cycle as we know it.

Source: Marathon
Introduction
Gulf Marine Services (GMS: LN) is a liftboat provider serving the Oil and Gas industry operating in the UAE, Saudi Arabia, Qatar, the UK, and the rest of Europe. GMS is highly levered with £282M of net debt as of Jun 22. It is currently trading at around 1.05x LTM P/FCF, 1.35x LTM P/E, and 4.70x 22E TEV/EBITDA, rapidly deleveraging and improving its capital structure. Even as its financial performance improved significantly year-on-year, GMS’ stock price remained relatively flat.
Although GMS has a significant debt load relative to its market capitalisation, we believe that the strong and improving free cash flow generated will accrue value from debt holders to equity holders as GMS continues to pay down its debt. We will address why GMS shares are priced so cheaply and the catalysts ahead that will remove this overhang.
GMS has been consistently generating free cash flow since 2017 after it stopped building new liftboats. While day rates have plummeted from USD50-60k/day in 2016 to sub-30k/day from COVID to date, its free cash flow improved significantly as it focused on keeping operations lean, drastically reducing capital expenditure, and paying down its debt. However, costs remained bloated and much of the excess profits went into the pockets of the previous management. GMS was on the brink of default in 2021 before settling on re-negotiated terms with their lenders.
Seafox then launched an activist campaign against the former board. The activist, who now has 29.99% of the shares outstanding, emerged victorious, refreshed the board, and appointed a new CEO. The new management team managed to re-negotiate with lenders for better terms and averted bankruptcy in March 2021. Interest expenses fell, costs remained controlled as revenue improved, free cash flow and EBITDA increased, debt repayment accelerated, and covenants are no longer breached. With the improved terms, GMS now has a large margin of safety in satisfying the ongoing debt covenants, generating the FCF and EBITDA to pay down the debt, and eventually refinancing the residual debt by 2025 maturity.
The story is straightforward: Most institutional investors have exited over the years as they faced bankruptcy risks and messy activist campaigns. The former management has repeatedly missed guidance and failed to deliver on their promises; investors lost the little confidence they had left, and most moved on. This is now a micro-cap stock trading at <US$100M market capitalisation even as its underlying fundamentals (day rates, margins, debt repayment, better stewardship, better execution) has noticeably improved. The sentiments around this stock are so poor that we believe that any small positive news, such as the evidence of continued debt repayment or compliance with debt covenants, is sufficient for a quick rerating.
Investment Thesis
Background and History
GMS was established in the UAE in 1977 and has expanded its fleet and geographical coverage from Abu Dhabi to globally. It owns and operates 3 asset classes: 4 Large Classes (E class), 3 Mid-size Classes (S Class), and 6 Small Classes (K Class) with an average age of only 11.1 years. The expected useful life is 40 years and the industry average age stands at around 25 years. The older the vessel is, the less valuable and relevant it will be.

4 Units
Avg age: 9 years
Max Water Depth: 65-80m
ASSET CLASS OVERVIEW
Mid-Size Class (S Class)
3 Units
Avg Age: 6 years
Max Water depth: 55m
Small Class (K Class)
6 units
Avg age: 15 years
Max Water depth: 45-55m")
Source: 2022 H1 GMS Presentation
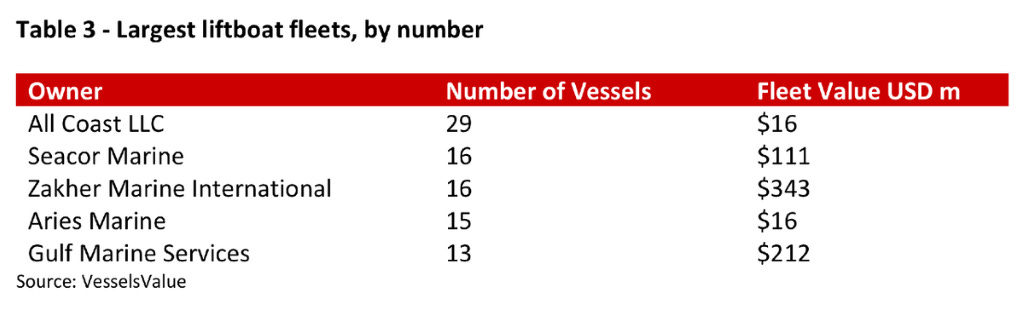
GMS also has one of the largest liftboat fleets, by number and by value in the world.
GMS was listed on the London Stock Exchange in 2014 at the peak of the previous oil cycle, where day rates for liftboats were sky-high. GMS used the capital raised from the IPO and debt issued between 2014 and 2016 to inopportunely expand the fleet from 9 to 15 SESVs.

Source: 2015 GMS Annual Report
The increased debt burden and falling day rates made it significantly onerous for GMS to deleverage at a satisfactory pace. The former management team resorted to cost-cutting programs and restructuring in a bid to reduce cash outflow to satisfy debt covenants and repay debt.

FY 2015
% Reduction
Year
IH 2018
Small Class
$10,000
-10%
Small Class
$9,000
Mid-Size
Class
$17,000
-29%
Mid-Size
Class
$12,000
Large Class
$21 ,ooo
Large Class
$15,000
Primarily achieved by:
Reduction in crew salaries cost
Reduction in well servicing cost
base through employment of
in-house equipment and personnel
Reduction in catering costs
through renegotiation of contract
(2016)
Reduction in daily operating
costs through other supply chain
efficiencies
Average reduction in daily opex
in excess of 20%
Vessel Opex Costs are variable and very much dependant upon client
requirements and scope of work (see Appendix)
For example, we have one small class vessel operating in MENA with
average daily operating costs of $7,500 (including c. $900 per day of costs
relating to the specific contractual requirement to provide well servicing
equipment and personnel)")
Source: 2018 GMS presentation
However, this proved to be inadequate as they breached the debt covenants in 2020 as the industry plummeted to fresh recent lows. Both day rates and utilisation rates were deteriorating rapidly in the face of vanishing offshore oil production.
Activist Campaign: Seafox & Mazrui
Seafox is a global jack-up company, providing services to the offshore energy industry. Seafox and HM MOS merged in 2014 to form the largest jack-up ASV firm and were delisted from the stock exchange. They operate 11 of their own SESVs and were operating at 100% utilisation in 2019.
Seafox, with Mazrui under its lead, first established a stake in GMS in January 2019, requesting a Board overhaul, a stronger emphasis on cost-cutting, and fixing its capital structure. In March 2019, Seafox sent GMS a public letter highlighting pertinent issues for the board to solve and demanding certain changes to be made.

Source: March 19 Seafox letter to GMS Board
This commenced an intense series of back and forth between Seafox and GMS board. The timeline is as follows:
Jan 19: Seafox first became shareholders
Mar 19: Seafox sent a letter highlighting mistakes and mitigations required.
30 Apr 20: Seafox offered for GMS at US$0.09 per share.
05 May 20: Seafox purchased 9.4m more shares in the open market and increased its offer for GMS by 38% to 10 pence a share.
28 May 20: Seafox dropped the offer.
02 Jul 20: GMS re-instated two board members which the majority of shareholders had resolved not to re-elect in the AGM.
07 Jul 20: GMS’ board justification against Seafox Resolutions.
13 Jul 20: Public statement regarding GMS’ blatant disregard for the outcome of the AGM. Seafox also refuted a series of blows GMS’ former board made against them.
Several notable points:
“Our announcements of 30 April 2020 and 5 May 2020 in relation to a possible offer for GMS reflect our belief that Seafox has the industry expertise to improve GMS’s operational performance and drive value creation. We note that the price of 10 pence per share stated in our announcement of 5 May 2020, represented a premium of approximately 257% to the closing price of a GMS share on 24 April 2020 (being the last day prior to Seafox’s approach to GMS).
Since the end of the offer period, Seafox has acquired a further c.32 million shares in GMS, representing c.9% of Seafox’s issued share capital. This makes Seafox the single largest shareholder in GMS and the largest investor in additional shares (+16% increase) in the last 12 months. These further share acquisitions demonstrate that we are a committed shareholder in GMS and are fully invested in GMS’s future success.
Of course, we want to maximise the value of our investment and we genuinely believe that we have a lot to offer to the Board. ”
“GMS’s continued renegotiations with its lending banks are evidence of why further experience is required on the Board. On 10 June the Board announced that it had signed a Bank Deal that included a condition requiring a $75m equity raise by the end of this year in order to avoid the incurrence of PIK interest and issue of warrants to the Bank syndicate of up to 20% of GMS shares, if fully vested, without first getting a mandate or approval from shareholders at the AGM for such an equity raise and these punitive warrant conditions. It requires GMS to raise $75m in fresh capital – a 1.4x multiple of its current market capitalisation - in order to avoid potentially onerous PIK interest accruing and the issue of warrants whose terms have not been fully revealed. This high risk strategy, given current market conditions, was pushed through by the Board, without any shareholder approval and without first putting it forward to a General Meeting that was held 20 days later.”
30 Jul 20: GMS accused Seafox to be acting in concert with other shareholders.
10 Nov 20: Seafox won, Board replaced, ex-CEO suspended.
GMS experienced positive developments since the new board and management team took over.
Business Performance
2021 v 2020

USS
-20m
Description
Revenue reflects the amounts recognised
from operating activities with clients during
the year. It is driven by charter day rates
and utilisation levels.
Utilisation is the percentage of days that
vessels within the fleet Of SESVs are chartered
on a day rate out of total calendar days.
Adjusted EBITDA (Earnings before Interest,
Tax, Depreciation and Amortisation),
excluding adjusting items (exceptional costs
and non-cash impairments). It is a key
measure of the underlying profitability of
GMS' operations.
Adjusted EBITDA margin demonstrates the
Group's ability to convert revenue into profit.
Adjusted net profit or loss measures the net
profitability of the business adjusted for items,
such as restructuring costs, and non-cash
transactions, such as impairment.
Adjusted DEPS means fully diluted earnings
per share and adjusted DLPS means diluted
loss per share, which measures the level of
net profit/loss, including adjusting items,
per ordinary share outstanding.
2021 performance
Revenue increased by 12.3% to US$ 115 million
mainly attributable to an increase in E- & S-
Class utilisation.
Utilisation in the year improved to 84% (2020:
81%), S-Class utilisation improved from 92%
in 2020 to 98% in 2021 with vessels benefiting
from long-term contracts. E-Class utilisation
levels saw an increase to 72% (2020:65%).
K-Class utilisation remained flat at 86%
Adjusted EBITDA significantly increased by 27%
to US$ 64 million (2020: US$ 50 million) driven
by increased utilisation across the E- and S-
Class fleet.
Adjusted EBITDA margin increased to 56%
(2020:49%) despite COVID-19 costs, as a
result of increased utilisation and the annualised
impact Of 2019 and 2020 cost reductions
taking effect.
The Group reported an adjusted profit of
US$ 18 million (2020: adjusted loss of US$
15 million). The significant increase was mainly
driven by increased utilisation and reduced
finance costs following the renegotiation Of
the Group's debt facilities in March 2021.
US$ -sm ADLPS USS (002)
ADEPS USS 001 USS sm
Numbers - Adjusted DLPS/DEPS
Bars — Adjusted profit/loss")
GMS managed to improve the top-line and bottom-line by increasing the utilisation rate and keeping costs low. The high utilisation rate and superior cost management have increased GMS’ adjusted EBITDA and adjusted EBITDA margins to levels much higher than in 2017 and 2018. GMS has also managed to squeeze out positive net profit since 2017. It is crucial to note that this fundamental improvement occurred in the face of worse industry conditions - the day rates in 2017 and 2018 were much higher at around US$36k to US$39k per day. It was US$25k per day in 2020 and US$26k per day in 2021.

Vessel Class
K-Class vessels
Other vessels
Total
Revenue
US$'OOO
2021
38,680
33,420
43,027
115,127
Adjusted gross profit/(loss)
2020
29,407
32,136
40,947
2
102,492
US$'OOO
2021
21,277
15,897
23,568
(116)
60,626
2020
(26,047)
15,797
(45,076)
(202)
(55,528)
US$'OOO•
2021
11,170
15,897
18,716
(116)
45,667
2020
(22)
15,797
16,055
(202)
31,628
• See Glossary and Note 30 of the consolidated financial statements.")
Source: 2021 GMS Annual Report - Vessel revenue and gross profit
Under the new management stewardship, E-class vessels enjoyed greater profitability one year on. However, the incremental costs required for upgrading in anticipation of higher utilisation rate partially masked the true benefits of its cost-cutting initiatives.
Capital expenditure - The Group’s capital expenditure during the year reduced to US$ 12.2 million (2020: US$ 14.2 million). Expenditure mainly relating to upgrades made to vessels to meet client requirements. The Company continues to maintain capital expenditure at a level that ensures safe operations, in line with legal and regulatory obligations, and that meets client requirements, as it focuses on maximising its cash generation to continue reducing bank debt.
Even as GMS continued to increase its utilisation rate and activity, it has so far been successful in keeping capex minimal. We believe that this is due to the new board’s involvement and their extensive knowledge of the industry; and its relatively young fleet of liftboats.
The new management was able to swiftly remove cost bloats and get the company back on track to a much higher FCF generation.
Renegotiated Bank Deal
On 10 June 2020, GMS was required to raise US$75M worth of equity to prepay the Term Loan facilities by 31 December 2020. If they failed to do so, they had to issue warrants to the lenders on 4 Jan 21, with its contingent PIK accruing at 5% p.a.
In November 20, a new board was appointed. They successfully concluded negotiations with the Lenders in March 21. The interest payable in the term borrowings was reduced from LIBOR + 5% to LIBOR + 3%. The Lenders provided the company with an extension to raise US$75M of equity or 87,621,947 warrants. The warrants, if fully exercised, would give the Lenders the rights to approximately 134M ordinary shares, 11.5% of the share capital of the company, for a total consideration of 6.0p per share.
The company successfully raised an initial US$25M of new equity in June 2021. GMS must now either (a) raise another US$50M in new equity by 31 December 22, or (b) issue the Warrants to the Lenders on 2 Jan 2023. The management expects option (b) to be the most likely choice.
With the renegotiated bank deal, the interest on bank borrowings was reduced by 36.5% to US$17.5M (2020: US$27.6M). However, do take note that LIBOR has increased substantially in the current rising interest rates environment.
The debt carries the following specifications and covenants:
Matures in Jun 2025
Secured by GMS’ fleet of 13 liftboats, with a net book value of US$552.1M
Debt Service Cover ≥ 2.5x
Defined as the ratio of Adjusted EBITDA to debt service
Interest Cover ≥ 1.2x
Defined as the ratio of Adjusted EBITDA to Net Finance Charges
Net leverage ratio ≤ 6.1x
Defined as the ratio of net bank debt to Adjusted EBITDA
If the net leverage ratio > 4.0x, PIK starts to accrue in the following manner:
Under the banking documents dated 17 June 2020 and 31 March 2021, PIK is calculated at 5.0% per annum on the total term facilities outstanding amount and reduces to: a) 2.5% per annum when Net Leverage reduces below 5.0x b) Nil when Net Leverage reduces below 4.0x Under the documents dated 31 March 2021, PIK accrues on either 1 July 2021 if the US$ 25 million equity is not raised by 30 June 2021, or from 1 January 2023 if the US$ 50 million is not raised by 31 December 2022. PIK stops accruing at the date on which all loans are paid or discharged in full.

Source: 1H 21 GMS Presentation - Cash sweep mechanism
The re-negotiated terms also force the management to focus on continued structural cost-cutting, free cash flow generation and implemented a cash sweep mechanism that exacts deleveraging. The risk of poor capital allocation is virtually mitigated because of this requirement.

until 30 June 2025
6 Bank syndicate —3 UAE, 1 GCC and 2 International
Covenants on leverage, debt service, interest cover, loan to
value, caps on capex and SG&A
Warrants and PIK applied if 550m of new equity not raised
by end of 2022 ($25m raised by 30 June 2021). No PIK if
leverage <4.Ox)
Cash sweep mechanism for surplus cash
Renegotiated Bank Deal (March 2021)
Renegotiated bank deal offers clear path to right size the balance sheet:
Deleveraging, leading to a transfer Of value from lenders to equity
holders
Renegotiated bank deal saving $53m over 2021 and 2022:
$15m on margin reduction & 538m of PIK Interest,
Reduced initial equity raise requirement from $75m to $25m
(Completed June 2021)
Longer time granted to raise additional $50m of equity — opens
possibility of future refinancing instead of second equity raise")
Source: GMS H1 22 Presentation - Current state of debt
Under the new management, GMS managed to reduce its net bank debt from US$406M in 2020 to US$341.4M as of June 22.
2022 H1 v 2021 H1
, driven by
o increased utilisation for HI 2022 to 89% (HI 2021: 77%) with notable improvements in E-Class vessels at
87% (HI 2021: 57%)
o increased HI 2022 average day rates to $27.2k (HI 2021: US$ 25.5k)
HI 2022 EBITDA increased to US$ 37.3 million (HI 2021: US$ 26.5 million) due to an increase in revenue and
a continued focus on costs savings
HI 2022 Net profit after tax was US$ 13.1 million (HI 2021 US$ 2.0 million) mainly driven by an increase in
revenue. Gross profit margin improved to 41% (HI 2021: 32%)
Net debtl reduced by US$ 29.9 million to US$ 341.4 million (31 December 2021: US$ 371.3 million) as the
Group continues its focus on deleveraging")
GMS’ business performance continues to improve in H1 2022 with utilisation and day rates increasing, while costs remain flat (+1% vs H1 2021). Capital Expenditure actually decreased to US$3.7M (H1 2021: US$8.9M) while cash flow from operating activities increased to US$ 42.2M *H1 2021: US$22.1M).
The management is guiding to an EBITDA of US$70 - 80M. With minimal capex required this year, we can expect the organic free cash flow generated to be substantial. Most of the cash generated has been and will continue to go to deleveraging the balance sheet.
Assuming that GMS manages to hit its conservative US$75M adj EBITDA target, it will be comfortably in compliance with the covenants.
Net Leverage Ratio: Ratio of net bank debt to adjusted EBITDA
US$341M net bank debt (1H 22)
US$310M net bank debt (end 22, if pay down another $30M)
2022E adj EBITDA circa US$70-80M
Ratio: 4.10x
The CEO has stated that they expect the net leverage ratio to be under 4.0x by either end of this year or mid-2023. This is increasingly likely as they have shown their ability to generate strong free cash flow even in the current cyclical downturn - day rates have not been improving much since COVID lows.

Source: H1 22 GMS Presentation - depressed day rates
CEO - Mansour Al Alami
Al Alami took on the CEO position in November 2020 after the activists successfully controlled the board and removed former CEO Tim Summers.
Please have a look at this article for more about his background and commitment to GMS.
Background
“ “The company is strong. It has a good fleet of 13 self-propelled, versatile vessels. The fleet is young. And the market opportunity is great. All the factors are there for success,” he says.
Al Alami has spent much of the past two decades in corporate turnaround mode, most notably with Abu Dhabi-based oilfield services company Al Bawardi Enterprises/EMDAD, where he held senior positions including general manager, chief executive and advisor to the chairman and board of directors.”
Demand-side
“Market conditions are favourable for GMS to build on that, Al Alami says: utilisation rates are high, dayrates are rebounding and production activities are picking up in the Gulf region where the company does most of its business.
Adnoc has famously announced its plans to boost production to 5 million barrels per day by the end of the decade, an increase of 25%.”
Supply-side
“A rapid increase in offshore wind installation in China has also sapped the market of vessels, draining away some competition. “And we do not see new vessels coming on the market in the next few years,” he says.
Asked for his near-term vision, Al Alami exclaims, “We're going to turn around the company, get rid of the debt and start paying dividends!”
He laughs, and continues: “But really, our objective in the next two years is to deleverage to a level that is attractive to lenders and investors, and then move into profits and dividends, and return equity to shareholders.” "
It is also crucial to take note of the current CEO’s compensation structure.
Tim Summers, the former CEO, was collecting fat fees as part of the board and also as the then CEO of GMS.
He received US$233,000 as the chairman in 2020, US$623,000 fixed salary, and US$267,000 annual bonus even though the share price (and value) deteriorated drastically under his stewardship.
This is in contrast to Mansour Al Alami's US$0 director fee, US$449,000 fixed salary, and US$210,000 annual bonus as he managed to avoid default, renegotiated for much better terms with the lenders, hit EBITDA targets and secured much higher utilisations and day rates for 2022.
Furthermore, the new CEO Mansour Al Alami has been increasing his interest in ordinary shares by purchasing in the open market since he took over. This is partially motivated by the remuneration policy. He has since increased his holdings steadily to 2,571,000.

1,169,149
1,055,354
Open Market
Acquisition
Open Market
Acquisition
Open Market
Acquisition
Open Market
Acquisition
Open Market
Acquisition
Open Market
Acquisition
Open Market
Acquisition
Open Market
Acquisition
Open Market
Acquisition
Open Market
Acquisition
Open Market
Acquisition
Open Market
Acquisition
Open Market
Acquisition
Open Market
Acquisition
Open Market
Acquisition
Open Market
Acquisition
Open Market
Acquisition
Other Acquisition
Open Market
Acquisition
Open Market
Acquisition
Open Market
Disposition
Open Market
Acquisition
Open Market
Acquisition
o.
09
Forager Funds Management Pty Ltd.
Seafox Operations B.V.
Seafox Operations B.V.
0.07
0.07
0.05
0.04
0.04
0.04
0.11
0.11
0.11
0.11
0.11
0.11
0.11
0.11
0.09
0.11
0.09
0.11
0.11
0.11
2,571,000
2,393,000
1,672,200
1,000,000
72,922,151
72,814,715
72,499,715
72,211,912
72,190,135
72,109,295
71,774,124
71,561,275
71,391,341
69,811,379
69,693,839
69,245,374
69,245,374
68,194,443
o
67,941,847
57,455,169
Change Eiled_Dage
7.44 Feb-Ol-2022
8.67 Jan-25-2022
31.68 Oct-13-2021
67.22 Jul-08-2021
66.67 Jul-05-2021
New Jul-01-2021
0.15 May-29-2020
0.43 May-28-2020
0.40 May-27-2020
0.03 May-27-2020
0.11 May-22-2020
0.47 May-21-2020
0.30 May-20-2020
0.24 May-19-2020
2.26 May-18-2020
0.17 May-15-2020
0.65 May-14-2020
1.17 May-13-2020
0.36 May-13-2020
0.37 May-12-2020
(100.00) May-13-2020
18.25 May-07-2020
19.53 May-06-2020")
Source: CapIQ
The incessant focus on deleveraging and satisfaction of <4.0x adj EBITDA requirement is also further explained by an alignment of interest.
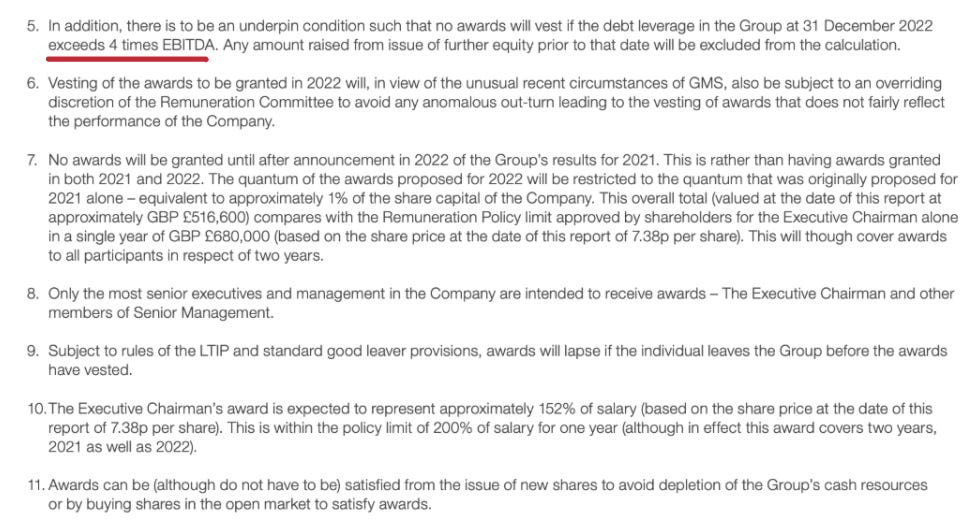
There is a huge incentive for the CEO to quickly get the net leverage ratio below 4.0x EBITDA as soon as possible or he will not be entitled to any of the LTIP awards.
Industry
Liftboats go by several names in the marine industry, depending on the companies that own them:
Liftboat – used by USCG & ABS
MOU (Mobile Offshore Unit) – used by Lloyds Register; but also incorporates other types of vessels like Drill Ships and Semi-Submersible drilling rigs that might not necessarily be Self-Propelled
SESV (Self-Elevating Support Vessel) – used by owner/operator GMS
MPSEP (Multi-Purpose Self-Elevating Platform) – used by owner/operator Seafox & shipyard Keppel
SEWOP (Self-Elevating Work-Over Platform) – used by owner/operator Halliburton & oil company Chevron
SEP (Self-Elevating Platform) – used by Naval Architect GustoMSC and Bennett Offshore
Jack-Up Barge – used in the Gulf of Mexico prior to USCG regulation as a marine vessel
Jack-Up - used by UK Renewable (ex. BWEA) but are not necessarily self-propelled
Wind-Farm Installation Vessel – used generally in the renewables industry but is not necessarily self-propelled
SEAPUP (Self Elevating And Propulsion Utility Platform) - used by ARCO, BP and Pertamina, at West Java Sea.

Source: Noia
A jack-up is a rig that sits on top of a floating barge. Once positioned, the jack-up can extend its legs down to the sea floor. Once each leg is secured, the jack-up rachets the legs so that the platform rises above the water level.
A liftboat is a self-propelled, self-elevating vessel used in support of various offshore mineral exploration and production or offshore construction activities. GMS owns a fleet of liftboats that operates at a maximum water depth of 45-80m, directly competing against jack-up rigs and barges.
A liftboat costs only 1/3rd as much as a jack-up for a rig move. For a campaign with 20 wells and 10 locations, jack-ups will cost as much as US$18M while only US$12M for a liftboat, not including other opex savings.

Source: 1H 22 GMS Presentation - GMS liftboats vs comparables

Source: 1H 22 GMS Presentation - GMS vessel types
With higher crude oil prices for longer, producers are increasingly incentivized to explore and develop more oil wells both onshore and offshore drilling. Onshore day rates have been increasing in the first half of 2022 and offshore rates are following suit with a lag. The following are the average day rates and contracted utilization for various offshore drilling units over the past 2 years.
Drillship

—Utilization
@2022")
Semisubmersibles

100
80
60 *
40
20
Utilization
'2022 IHS")
Jackups


GMS’ fleet is mainly in the Middle East region while the above day rates are for Southeast Asia. So how are the day rates in the Middle East fairing? We were not able to find like-for-like day rate trends as we did above but we can form a complete picture by piecing a few data points together.
Rising day rates in Saudi Arabia
“The recent Saudi rig charters point to jack-up dayrates of $78,000 to $98,000 apiece, 20% to 30% higher than a year before.
Day rates for the region could soon pass $100,000 in the coming months, particularly for high-specification jack-up rigs.
Middle East oil companies have firm commitments to drill hundreds of exploration and development wells over the next few years, in line with their growth strategies.
A wave of expansionary investment from these regional giants could soon reach the point that spells newbuilding orders, which is something that some old hands in the market had wondered if they would ever see again.”
Jackup rigs dominating contracting activity
“Offshore rig contracting accelerated in the back half of April and the first half of May, bringing the month’s total to 43 contracts announced (plus seven year-over-year) for 60 rig years, according to Evercore ISI’s latest Offshore Rig Market Snapshot.
Jackups rigs received the bulk of contracting but floater rates are improving, the report noted.
The 74%/26% split in term of contracts and 90%/10% by rig years continue to favor jackups, says Evercore, as 20 term contracts were awarded including 16 for the Middle East (9 Saudi Arabia, 3 Egypt, 1 Iran, 1 UAE). “
Middle East demand drives rising jack-up market in 2022
“In a blog published last week, the firm’s head of rig market research Cinnamon Edralin noted that between January and the end of May 2022, contractors secured 100 jack-up charters equivalent to just shy of 165 rig-years of work.
The average duration for these new jack-up contracts is about 1.7 rig-years – noticeably above the average of around 1.3 rig-years last year.
Indeed, Esgian Rig Analytics recorded just 187 jack-up awards for 216.6 rig-years of work for full-year 2021, meaning contractors have already matched more than three-quarters of booked time in the first five months of the year.
“With 45 known jack-up requirements still open for this year, and the expectation that high commodity prices and an increased focus on energy security will likely add more near-term demand, 2022 jackup awards should outpace 2021 handily,” Ms Edralin said.
The Middle East is the clear driver of the trend, with the region booking over 43,000 days – roughly 119 rig-years – of work this year, and showing “no signs” of slowing down.
Almost all this work has been booked as multi-year charters, she added, and all scopes are scheduled to start either this year or next year.
And, while some of the backlog is comprised of renewals of existing charters, increasingly the region is absorbing units from other locations.
Of the 23 jack-up sales recorded by Esgian since the beginning of this year, at least 18 are Middle East buyers.
While the remaining five buyers are currently undisclosed, three of these jack-ups are understood to have been sold to the Middle East market, she noted.”
Valuation
How cheap is GMS?

Key assumptions:
Day rates improve marginally
Utilisation rates improve marginally
Interest rates continue to increase
Most if not all of the FCF generated is used to deleverage
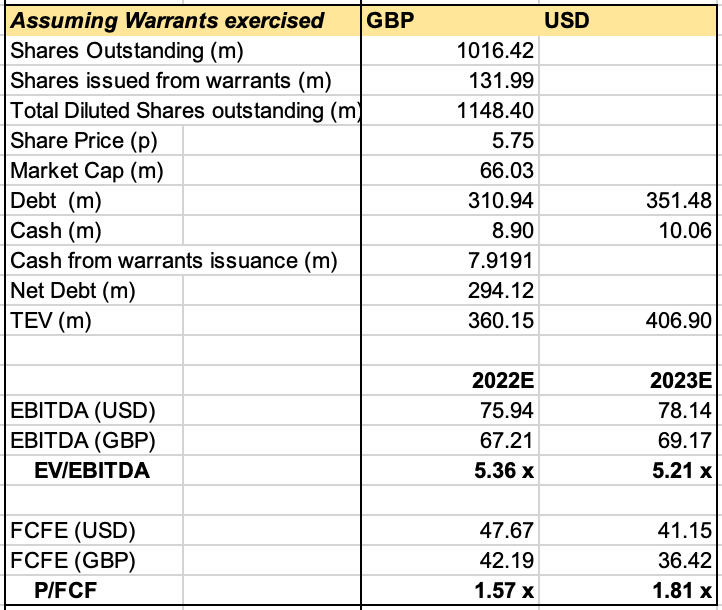
GMS is trading at approximately 5.0-5.5x EV/EBITDA and 1.5-2.0x P/FCF.
Where should GMS be trading at?
We can consider GMS’ valuation from two angles. The run-rate ‘fair’ multiple GMS used to trade at before having its debt concerns seems to be at around 8-11x TEV/EBITDA. This is reasonable and lies within the range of multiples offshore rigs tend to trade at.

An 8x multiple will get the fair equity value to 20-26p per share while an ambitious 11x multiple gets us to 40-46p per share.
Now, let’s have a look at GMS’ peers.

The direct competitors mentioned before are all private apart from Seacor Marine, which is not EBITDA- and FCF-positive. We resorted to looking at 2 profitable jack-up rigs and 3 deep water rig operators for comparison. The ‘fair’ range of multiple seems to be between 7.50x to 8.50x.
The more comparable two of the group, Shelf Drilling and Borr Drilling, are much less profitable and FCF generative compared to GMS. There can be a case for a much higher multiple assigned to GMS.

Source: CapIQ - Shelf Drilling Cash Flow Statement
Source: CapIQ - Borr Drilling Cash Flow Statement

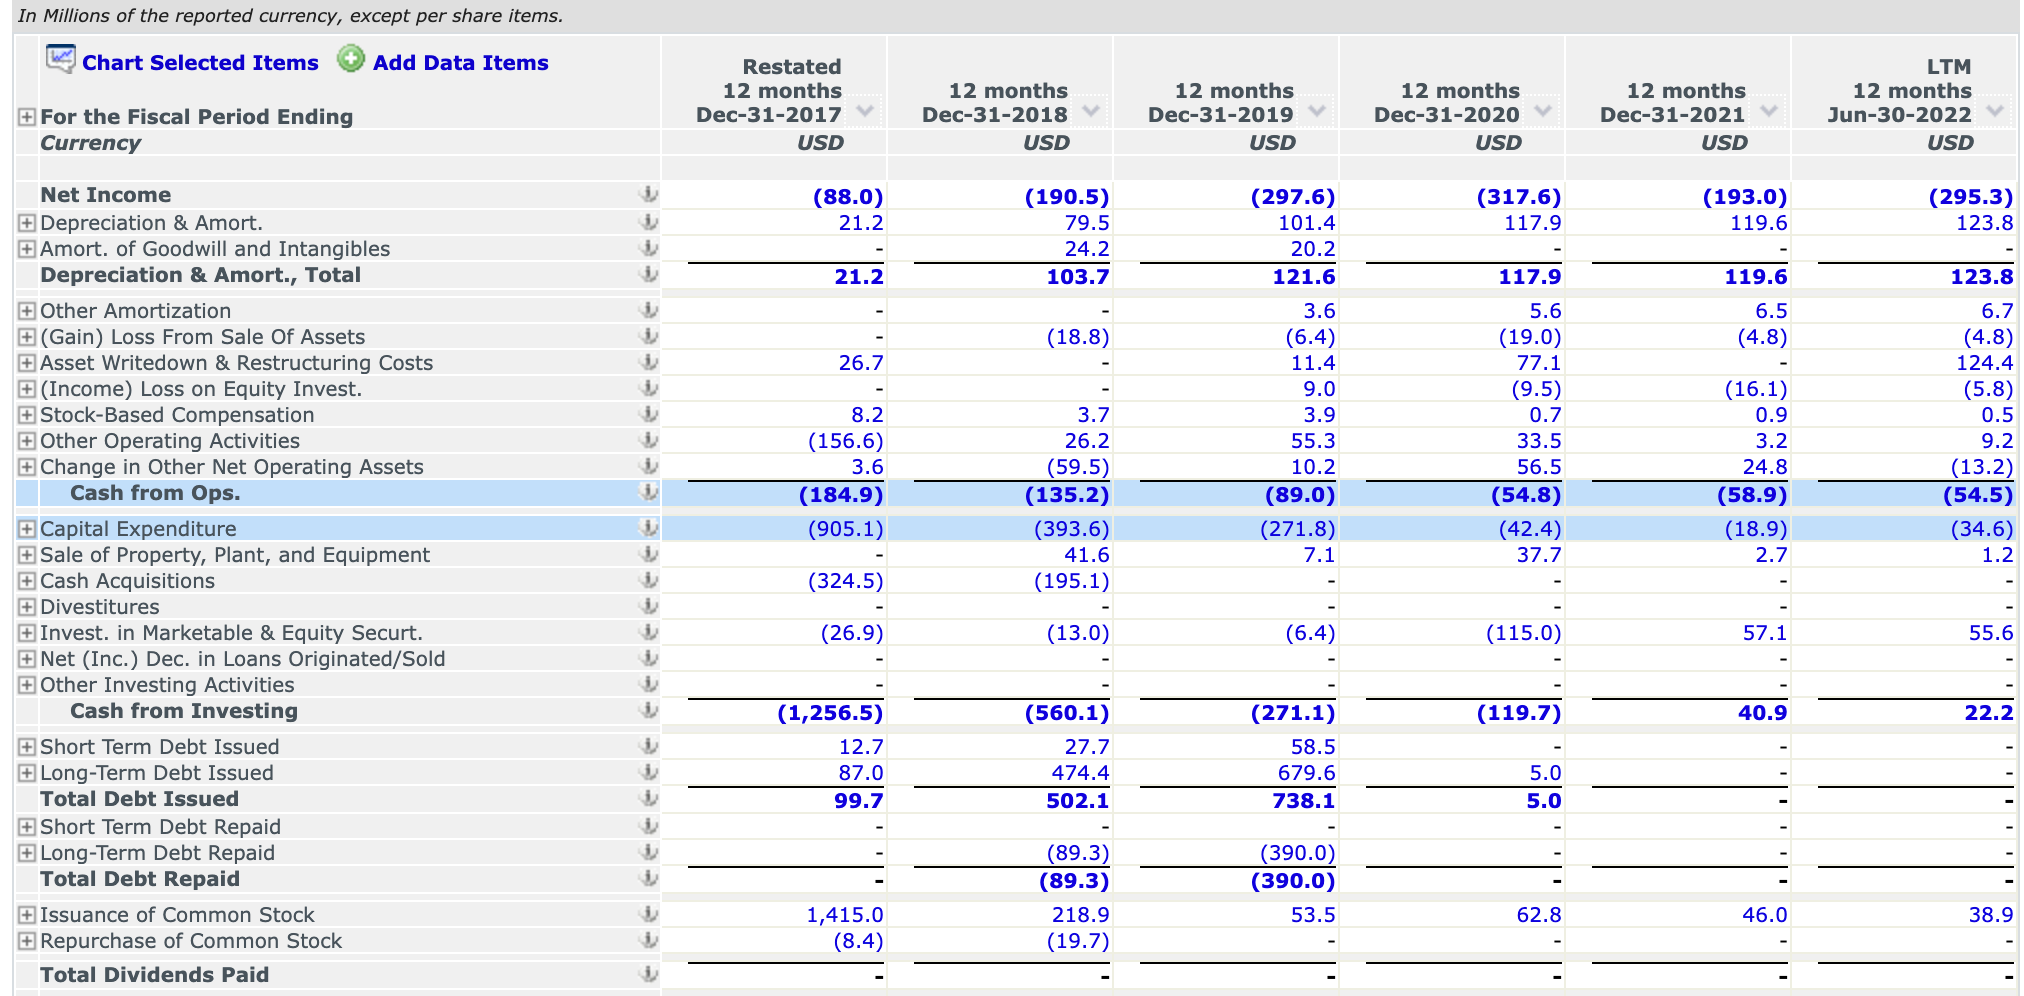
Source: CapIQ - GMS Cash Flow Statement
If you look through most of the other equipment and drilling companies, you will find similar cash flow situations as the above - capex-hungry, difficult working capital management, and evergrowing debt burden. GMS’ high-quality asset is a standout.
The following is a sensitivity analysis of how the fair valuation changes as the day rates and Utilisation rate change over time.

Base case - 7.0x - 8.0x TEV/EBITDA:


Bull case - 10.0x TEV/EBITDA:

As we can observe from the above analysis, the fair value of GMS is extremely sensitive to all three variables. However, it is clear that even in the most conservative scenario, the upside to the fair value is still substantial.
We have only considered what the fair multiple GMS should trade at. With the management aggressively retiring at least £35-45M of debt per year on a $66M market capitalisation, investors can enjoy an additional 53%-68% value accretion to the shareholder base in just the first year, on top of any value realisation reaped from re-rating.
What is required for value realisation then?
To answer this, it is important to consider why is the stock trading at such depressed multiples in the first place. It is paramount to note that the market is still pricing in a heightened risk of bankruptcy and further equity dilution. To avoid bankruptcy, GMS diluted its shares substantially in June 2022, with a clear intention to dilute even further in early 2023. This dilution overhang plays a role in depressing its share price temporarily. Besides, because of how GMS was previously grappling with elevated default risk, most of the institutional investors have cut their losses and exited the shareholder registry.

Source: Gurufocus - GMS Institutional Ownership
GMS has also been suboptimally managed in the past. The new management has executed extremely well by generating the required cash flow to pay down its debt and secure long-term contracts at higher day rates. However, the market has been fixated on rising interest rates, shunning all highly-indebted stocks, and, as a result, unfairly penalizing a highly cash-flow generative business like GMS.
There are three main ways the share price can rerate from here:
Generate free cash flow and repay debt. Taking current TEV/EBITDA as constant, a consistent deleveraging over the next two years can net investors 100-120% on the current share price.
Execute well in the current cyclical uptick. If management can continue to keep costs and capex low while repricing their contracts at much higher day rates, operating leverage will kick in and flow into its bottom line. If FCF increases, deleveraging will accelerate.
The market recognising that GMS no longer has any going concern risk and is indeed a high-quality profitable vessel operator. The multiple rerating here can potentially squeeze its fair value higher, even in this rising interest rate environment.

GMS continues to experience a strong and steady industry tailwind, rising utilisation rates and day rates. Excluding one-off costs and charges from the client’s BK, margins are increasing, capex remains muted, and FCF generation continues to be strong. The backlog is growing rapidly.
Deleveraging progress is satisfactory. On track to reducing net leverage ratio to <4.0x, where GMS does not have to pay PIK.
Disclosure & Disclaimer: The funds we control may own GMS shares. We reserve all rights to sell off, add, or trade around our position any time we wish to do so. This report is solely for entertainment purposes only and should not be considered as any form of stock recommendation.